The Fiefdom of Zealot Garren
The meaning to life, the universe, and everything
Region: Suspicious
Quicksearch Query: Zealot Garren
|
Quicksearch: | |
NS Economy Mobile Home |
Regions Search |
Zealot Garren NS Page |
|
| GDP Leaders | Export Leaders | Interesting Places BIG Populations | Most Worked | | Militaristic States | Police States | |

The meaning to life, the universe, and everything
Region: Suspicious
Quicksearch Query: Zealot Garren
| Zealot Garren Domestic Statistics | |||
|---|---|---|---|
| Government Category: | Fiefdom | ||
| Government Priority: | Law & Order | ||
| Economic Rating: | Good | ||
| Civil Rights Rating: | Good | ||
| Political Freedoms: | Below Average | ||
| Income Tax Rate: | 17% | ||
| Consumer Confidence Rate: | 101% | ||
| Worker Enthusiasm Rate: | 102% | ||
| Major Industry: | Pizza Delivery | ||
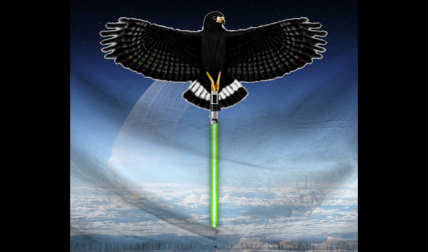
| National Animal: | black hawk | ||
| Zealot Garren Demographics | |||
| Total Population: | 7,241,000,000 | ||
| Criminals: | 817,514,247 | ||
| Elderly, Disabled, & Retirees: | 1,002,192,500 | ||
| Military & Reserves: ? | 276,285,425 | ||
| Students and Youth: | 1,207,798,800 | ||
| Unemployed but Able: | 1,143,656,401 | ||
| Working Class: | 2,793,552,627 | ||
| Zealot Garren Government Budget Details | |||
| Government Budget: | $15,768,307,021,591.35 | ||
| Government Expenditures: | $14,979,891,670,511.78 | ||
| Goverment Waste: | $788,415,351,079.57 | ||
| Goverment Efficiency: | 95% | ||
| Zealot Garren Government Spending Breakdown: | |||
| Administration: | $1,497,989,167,051.18 | 10% | |
| Social Welfare: | $1,647,788,083,756.30 | 11% | |
| Healthcare: | $1,947,385,917,166.53 | 13% | |
| Education: | $1,198,391,333,640.94 | 8% | |
| Religion & Spirituality: | $449,396,750,115.35 | 3% | |
| Defense: | $2,246,983,750,576.77 | 15% | |
| Law & Order: | $2,246,983,750,576.77 | 15% | |
| Commerce: | $748,994,583,525.59 | 5% | |
| Public Transport: | $1,497,989,167,051.18 | 10% | |
| The Environment: | $599,195,666,820.47 | 4% | |
| Social Equality: | $748,994,583,525.59 | 5% | |
| Zealot GarrenWhite Market Economic Statistics ? | |||
| Gross Domestic Product: | $12,977,400,000,000.00 | ||
| GDP Per Capita: | $1,792.21 | ||
| Average Salary Per Employee: | $3,110.75 | ||
| Unemployment Rate: | 24.29% | ||
| Consumption: | $46,463,814,069,125.12 | ||
| Exports: | $7,505,397,514,240.00 | ||
| Imports: | $7,604,512,751,616.00 | ||
| Trade Net: | -99,115,237,376.00 | ||
| Zealot Garren Non Market Statistics ? Evasion, Black Market, Barter & Crime | |||
| Black & Grey Markets Combined: | $29,530,080,882,639.94 | ||
| Avg Annual Criminal's Income / Savings: ? | $3,010.15 | ||
| Recovered Product + Fines & Fees: | $3,322,134,099,296.99 | ||
| Black Market & Non Monetary Trade: | |||
| Guns & Weapons: | $1,176,409,211,237.31 | ||
| Drugs and Pharmaceuticals: | $1,381,813,994,151.76 | ||
| Extortion & Blackmail: | $1,120,389,724,987.91 | ||
| Counterfeit Goods: | $2,054,047,829,144.50 | ||
| Trafficking & Intl Sales: | $1,008,350,752,489.12 | ||
| Theft & Disappearance: | $1,344,467,669,985.49 | ||
| Counterfeit Currency & Instruments : | $2,427,511,070,807.14 | ||
| Illegal Mining, Logging, and Hunting : | $672,233,834,992.75 | ||
| Basic Necessitites : | $1,307,121,345,819.23 | ||
| School Loan Fraud : | $746,926,483,325.27 | ||
| Tax Evasion + Barter Trade : | $12,697,934,779,535.17 | ||
| Zealot Garren Total Market Statistics ? | |||
| National Currency: | region | ||
| Exchange Rates: | 1 region = $0.18 | ||
| $1 = 5.48 regions | |||
| Regional Exchange Rates | |||
| Gross Domestic Product: | $12,977,400,000,000.00 - 31% | ||
| Black & Grey Markets Combined: | $29,530,080,882,639.94 - 69% | ||
| Real Total Economy: | $42,507,480,882,639.94 | ||
| Suspicious Economic Statistics & Links | |||
| Gross Regional Product: | $336,902,560,457,687,040 | ||
| Region Wide Imports: | $45,169,080,130,338,816 | ||
| Largest Regional GDP: | Sparkdottir | ||
| Largest Regional Importer: | Sparkdottir | ||
| Regional Search Functions: | All Suspicious Nations. | ||
| Regional Nations by GDP | Regional Trading Leaders | |||
| Regional Exchange Rates | WA Members | |||
| Returns to standard Version: | FAQ | About | About | 483,376,119 uses since September 1, 2011. | |
Version 3.69 HTML4. V 0.7 is HTML1. |
Like our Calculator? Tell your friends for us... |